
Equity markets continued to grind higher in the third quarter, demonstrating impressive resilience despite a cascade of obstacles from higher rates to geopolitical concerns in the Middle East. The S&P 500 gained 2.3% as technology stocks posted impressive earnings growth due to continued AI capital investment and large gains on private investments. Energy stocks also performed well, up 16.5%, likely no surprise to anyone who has recently filled up their gas tank. Overseas, positive performance in Japan and the UK helped foreign developed markets squeeze out a gain of 0.5%. Unfortunately, it was not an easy road for all stocks. Over 62% of stocks in the index had a negative return, and the same number of stocks were down 8% or more as had a positive return, creating significant negative skew. Many of the worst performers belong to cyclical or interest rate sensitive segments of the market, including stocks in mid-cap, small-cap, and the utilities, real estate, industrials, and consumer discretionary sectors. Fortunately for investors in the S&P 500, the 38% of stocks that were positive included most of the mega-caps with the largest allocations, offsetting weakness further down the portfolio. Microsoft gained 33% amid positive monetization trends on its compute investment. Meta Platforms, owner of Facebook and Instagram, rose about 18% after the debut of its AI agent, Muse. Software stocks, such as Salesforce (+40.9%), also outperformed as they recovered from worries that AI would make software obsolete.
One of the headwinds market participants navigated over the past few months was the sharp rise in interest rates. The chart below shows the Treasury Yield Curve, a plot of Treasury rates across varying maturities, at different points in time this year. You can see the meaningful shift up from the beginning of the year (green) into the end of August (teal), and then the additional sharp move higher to October 15th (blue). Rates with maturities of 1-5 years re-priced the fastest, with the 2-year note increasing nearly 130 basis points (bps) this year, while longer-term rates, like the 10-year, increased ~92 bps.
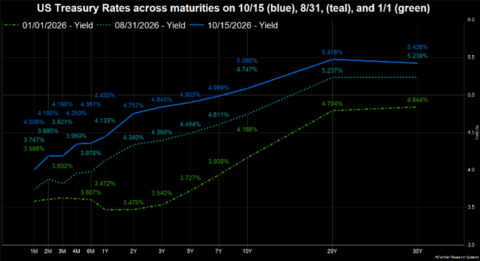
Interest rates have increased for a few reasons, but it seems the most meaningful was a reversal in the expected path of monetary policy. The Federal Reserve raised rates by 0.25% in September, but the Fed only directly controls the overnight (one day) rate, called the fed funds rate. It takes more than a small adjustment to the overnight rate to shift the entire yield curve higher by ~1%. In fact, if the Fed is expected to raise rates temporarily, it’s not unusual to see short-term rates rise while long-term rates are steady. Long-term rates rise and fall based on changes in long-term growth and inflation expectations as well as uncertainty around those expectations. As expectations for growth or inflation rise, or uncertainty around the growth and inflation outlook increases, long-term rates also rise. So, with long-term rates rising alongside short-term rates, the market is implicitly adjusting its expectations for one, two, or a combination of these factors.
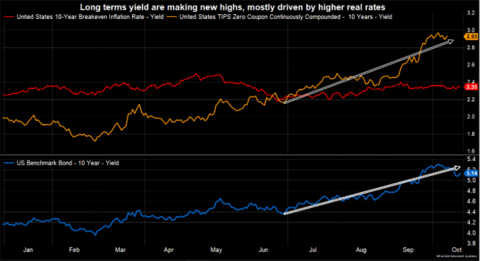
When we decompose the rise in long-term yields into its underlying drivers, it appears a rise in growth expectations is the culprit for higher yields. Market-based measures of inflation expectations, such as implied breakeven rates on Treasury Inflation-Protected Securities (TIPS), are only up about 10 bps this year (red in above chart), so inflation expectations aren’t contributing much. Furthermore, a decent proxy for the risk premium required by investors to accept the uncertainty of longer-maturity bonds, the term premium, is down this year and since the start of September. This leads us to conclude that the rise in rates is being driven by higher growth expectations and higher demand for long-term capital, reflected by a rise in real (inflation-adjusted) interest rates, as we see in the chart above (orange line).
As I’ve noted in past newsletters, economic growth has been healthy but concentrated within the AI buildout. AI spending is estimated at around ~$799 billion in 2026 and over $1 trillion annually in 2028 and 2029, according to JP Morgan. It’s showing up in the official numbers too. Spending on information processing equipment is up 17% compared to a year ago, while housing and non-technology investment spending are detracting. This has boosted nominal GDP growth, a measure of total spending within the U.S., to 6.6% from 5.5% year over year, the highest since Q2 of 2023. Spending must be financed, and hyperscalers rushing to build data centers have tapped private and public financial markets to raise capital. This is in addition to Treasury bond issuance, which continues to add about $1.8 trillion to debt markets annually. Both increase demand for funding, raising rates. AI investment has seemed price insensitive, accelerating despite rising rates and higher prices of technology components and other inputs; higher prices for technology components, like memory chips, have boosted consumer inflation by as much as 25 bps, according to Goldman Sachs Research. Meanwhile, unemployment has remained low and consumers continue to spend, especially high-income consumers whose equity portfolios have been boosted by AI earnings.
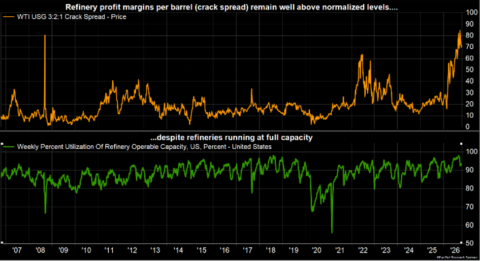
At the same time, geopolitical issues in the Middle East have created shortages of crude oil and fuel products. The price spike of diesel fuel is among the highest, up 128% this year, rising much faster than WTI and Brent crude, which are up closer to 80%. Even though crude oil has started to flow through the Strait of Hormuz again, it’s at significant cost due to high shipping and insurance rates. Still, more oil doesn’t immediately solve the problem of high fuel prices. Oil must be refined into gasoline, and as the bottom plot in the chart below shows, refineries in the U.S. have been operating near max capacity for the past few years. As countries in the Middle East, and recently Russia, pulled back on diesel exports, prices spiked as refineries could not increase production to fill the gap. The “crack spread” measures the profit margin per barrel refineries earn from converting oil to fuel (called crack spreads because oil molecules are “cracked” to break them apart). Shown in orange in the top plot below, they are near record highs. Existing refinery capacity constraints could keep crack spreads elevated. This has happened during peak seasonal gasoline demand amid summer vacations and now during fall harvest (and planting season in the Southern Hemisphere). Oil and fuel inventories have helped us thus far but are not a sustainable solution for the supply shortfall that persists.
The strong growth from AI investment and higher diesel prices is making life hard on the Federal Reserve. In late August, new Chairman of the Federal Reserve, Kevin Warsh, emphatically clarified his goal of achieving 2% inflation (as measured by the PCE price index) and put to rest speculation that he may look past recent higher-than-target inflation by excluding certain items that may be influenced by factors outside his control, including the aforementioned impact from AI investment and fuel prices, as well as tariffs. Some economists have suggested the Fed ignore these impacts since the Fed cannot address supply-side imbalances; “The Fed can’t pump more oil,” as the saying goes. Instead, Chairman Warsh insisted he would bring inflation, without exclusions, down to the Fed’s 2% target.
The problem is the forces pushing inflation higher are unlikely to be resolved soon and are unlikely to be mitigated by higher interest rates. The AI investment is continuing despite higher rates and prices, refiners cannot increase fuel production without additional capacity, and federal borrowing needs driving Treasury issuance cannot be solved by monetary policy. So, if Chairman Warsh is adamant about achieving 2% inflation, he will have to do so by slowing everything else, which likely requires a sustained period of restrictive monetary policy, i.e. higher real interest rates. The futures market not only priced in expectations for the Fed to raise rates a couple of times in 2026 and 2027, but also expectations for rates to stay at those levels through 2028. This took the market, which had expected rate cuts going into 2026, by surprise, causing the rapid move higher in rates.
For fixed income allocations, we continue to see value in allocating to short-term bonds. The shorter the maturity (or technically duration), the less bond prices go down when interest rates rise, all else equal. Over the past year, 1–3-year maturity treasury bonds outperformed 10-20-year bonds by over 7%, but neither has performed well given the sharp rise in rates. However, as rates rise, the thesis for fixed income could be more attractive for two reasons. First, higher yields contribute directly to return. Second, yield is a buffer against price decline; the higher the yield, the larger the buffer.
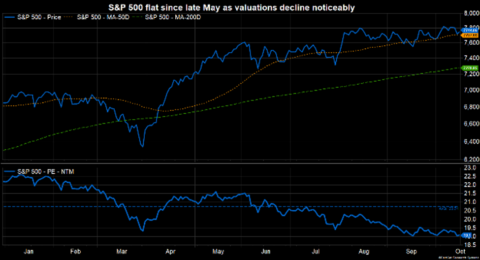
Higher rates have also made equities cheaper, from a valuation perspective. The S&P 500 is now trading at 19x FactSet earnings estimates for the next 12 months. This is down 15% from the beginning of the year. Despite the near correction in valuation, the S&P 500 has not had a 5% price drawdown since the initial Strait of Hormuz reaction (see chart below; price in top plot, valuation in bottom). This is due to strong earnings expectations that have increased since the year started, offsetting the decline in valuation.
While the rise in rates has dampened market sentiment in the second half of 2026, we see the market pricing in higher growth and real rates, which translates into higher yields and lower equity valuations for investors amid a backdrop of healthy earnings growth.
This presentation is not an offer or a solicitation to buy or sell securities. The information contained in this presentation has been compiled from third-party sources and is believed to be reliable; however, its accuracy is not guaranteed and should not be relied upon in any way whatsoever. This presentation may not be construed as investment, tax or legal advice and does not give investment recommendations. Indexes are unmanaged, are not available for direct investment, and do not reflect the deduction of advisory fees or other expenses.
Certain statements contained herein constitute forward-looking statements, expectations or projections. Such statements are based on current expectations and assumptions and are subject to risks and uncertainties. Actual results, market conditions and economic developments may differ materially from those expressed or implied. No assurance can be given that any forecast, projection or expectation will be realized.
Additional information, including management fees and expenses, is provided on our Form ADV Part 2 available upon request or at the SEC’s Investment Adviser Public Disclosure website, https://adviserinfo.sec.gov/firm/summary/109867. Past performance is not a guarantee of future results.

Jeff Cone, MBA, CFA®, CAIA®
Chief Investment Officer